Every year, Boulder County Parks & Open Space (BCPOS) gathers information about how many people visit our trails. Then, to better understand who our visitors are, what activities they enjoy, and their satisfaction with their experiences, we hit the trails and ask visitors to complete surveys. We have done county-wide visitor studies at our parks, regional trails, and neighborhood trails every five years since 1990. We use the information to follow long-term trends and learn how we can continue to improve the experience for you, the visitor.
This marks the first time that surveys at parks (e.g., Caribou Ranch) were done separately from surveys along regional and neighborhood trails (e.g., LoBo Trail). The decision to separate out regional and neighborhood trails was made because these trails differ significantly from parks that have distinct trailheads; they are found in more urban areas that travel through backyards and connect communities. Separating the surveys also allowed us to address questions unique to these trails, exclude questions that do not apply, and observe the differences from parks in visitation trends and visitor demographics. The results from the Regional and Neighborhood Trails study covers information gathered at three regional and three neighborhood trails, as well as comparisons to the surveys collected in 2021 during the Five Year Visitor Study at parks.
Key Findings
During the spring and summer of 2022, a visitor study intern collected 942 surveys (response rate 52%) at the following trails:
- Coal Creek Trail
- LoBo Trail
- Rock Creek Trail
- Twin Lakes
- Niwot Trails
- Boulder Canyon Trail
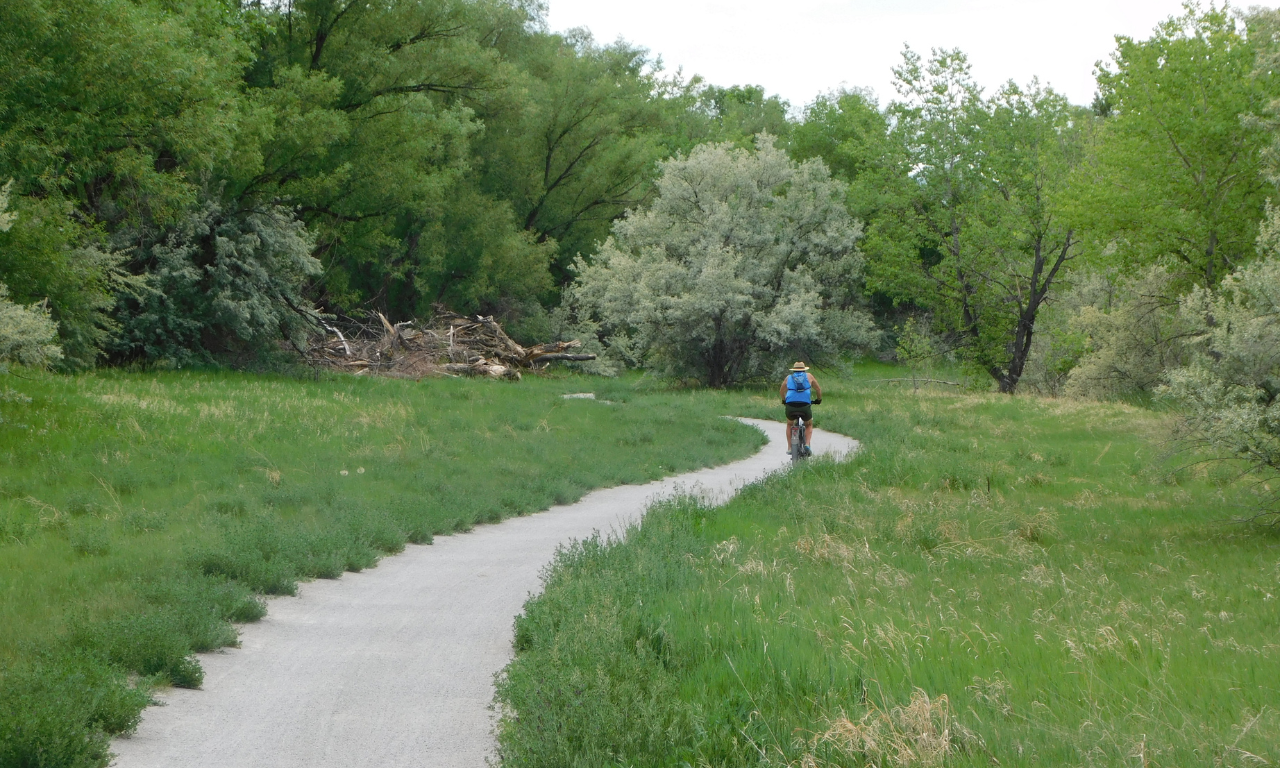
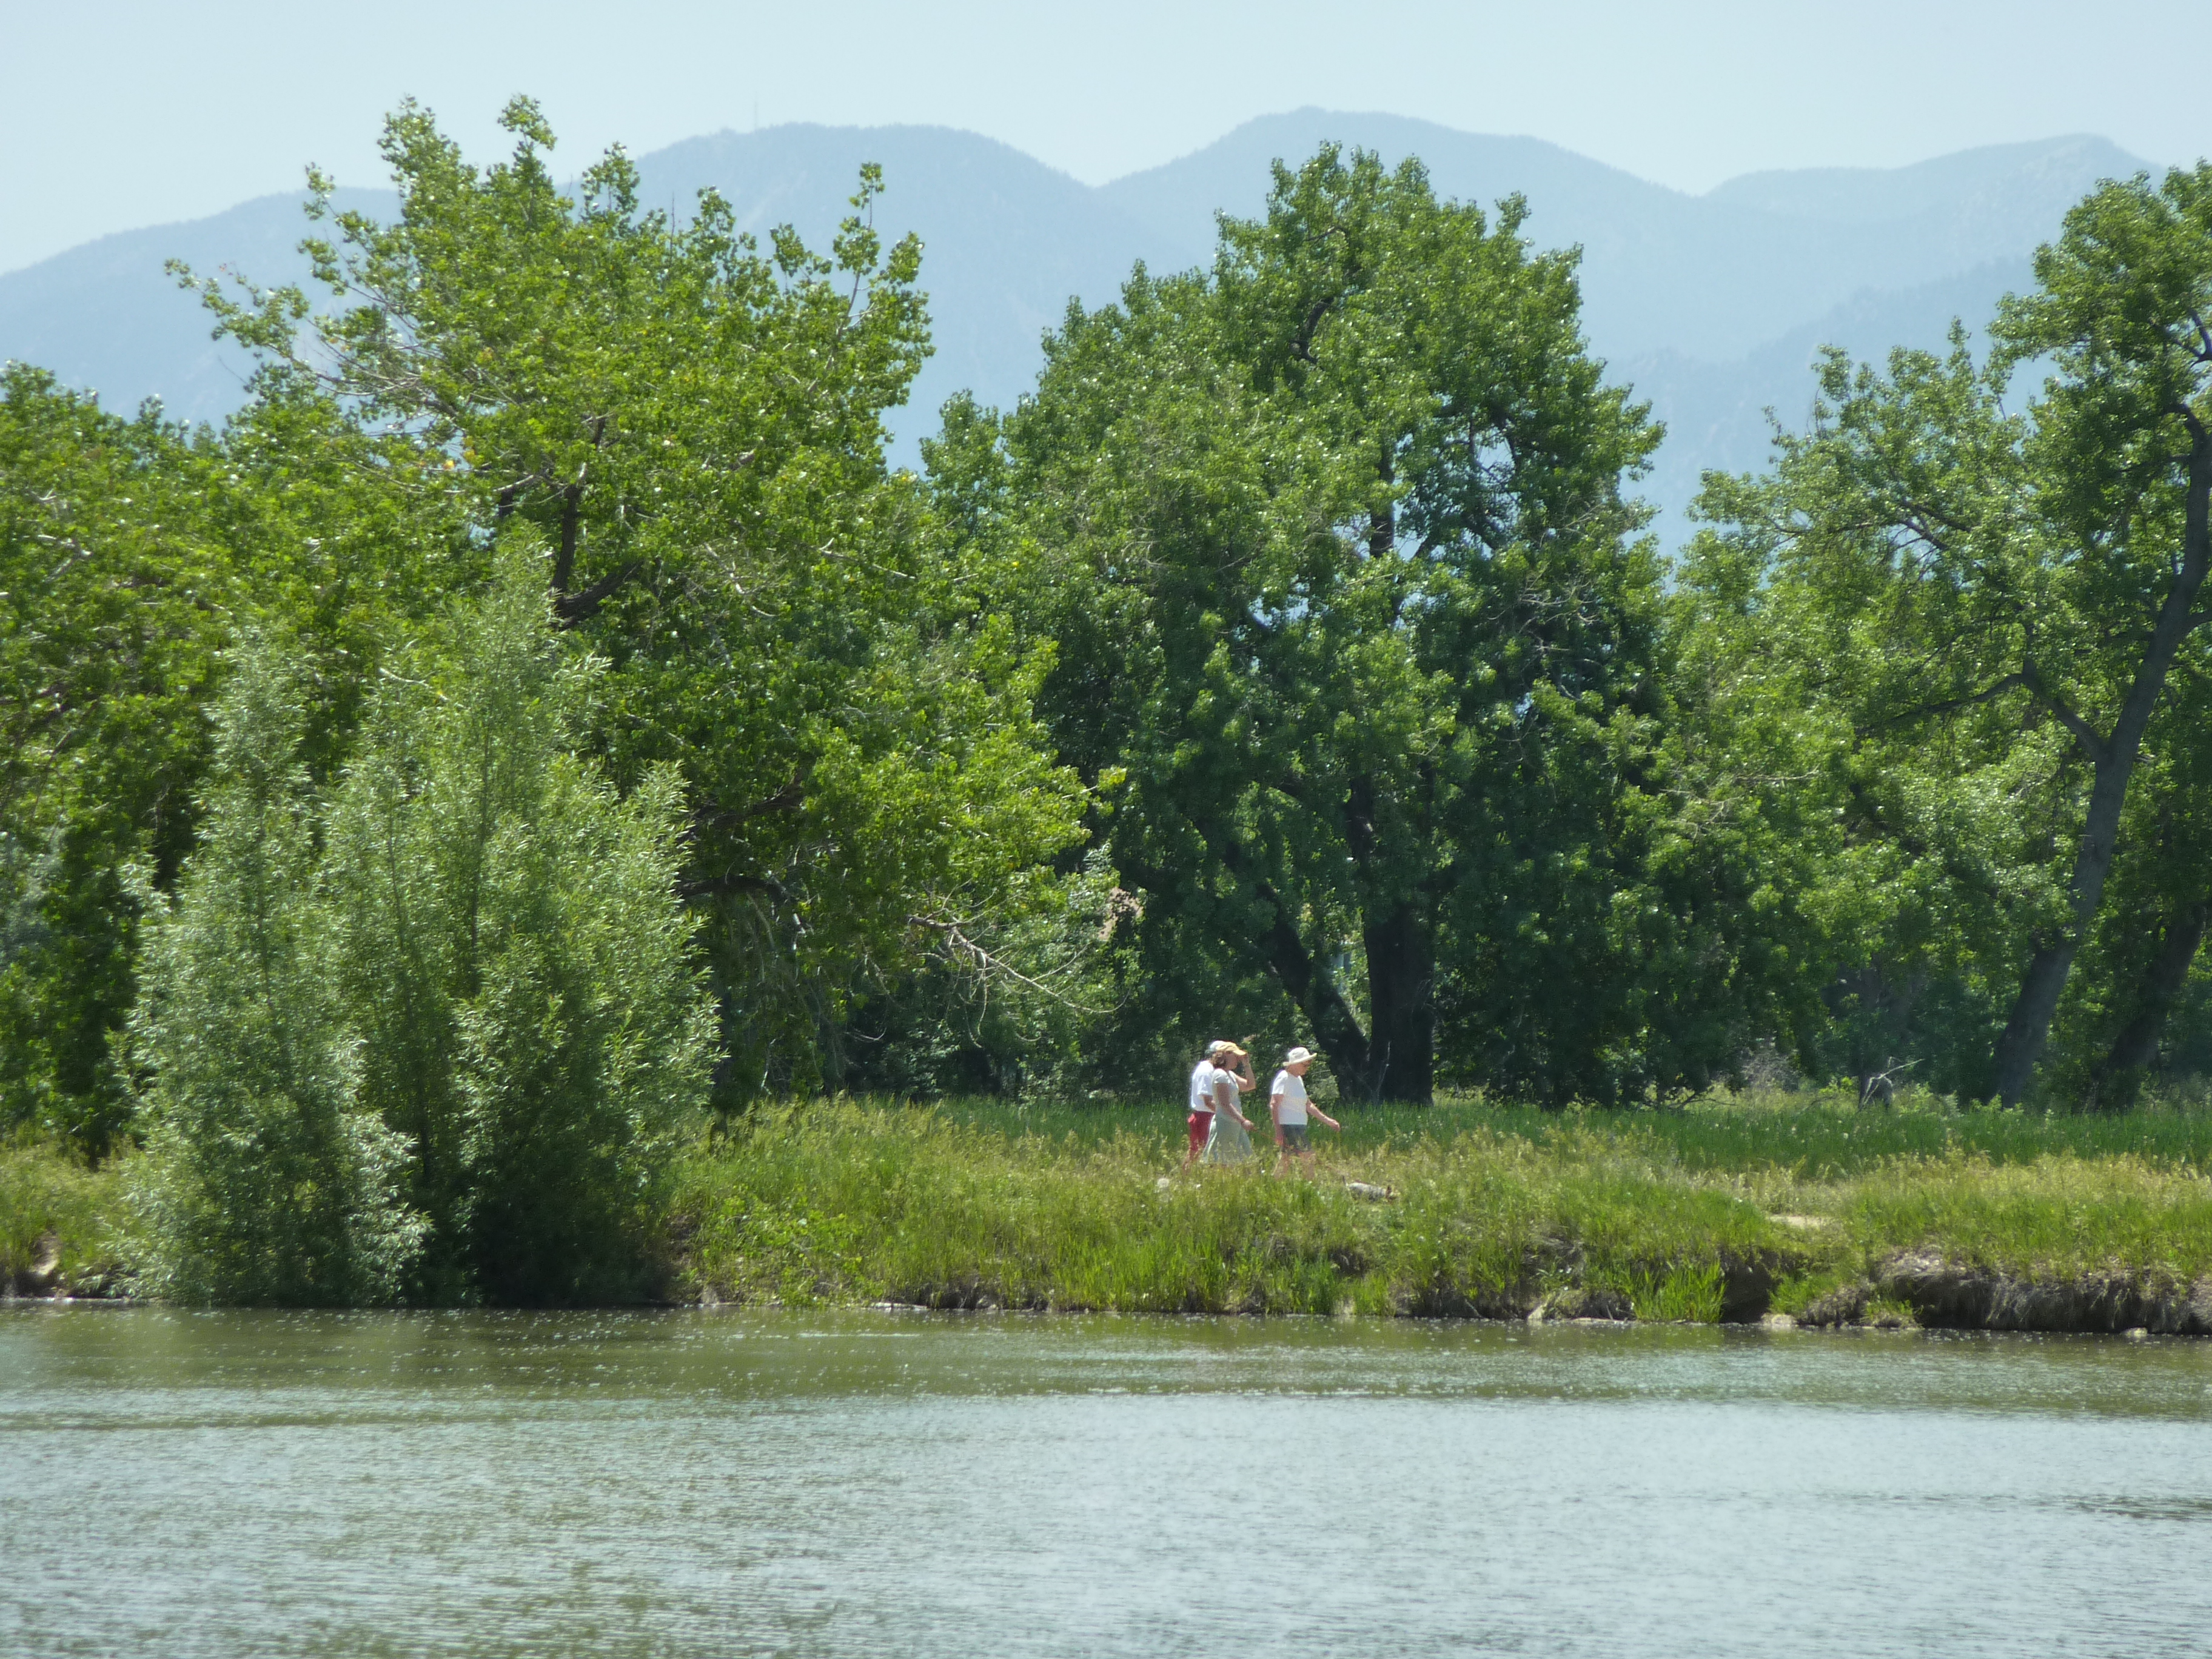
Visitors tend to visit alone (55%) or with family (31%). They generally visit the trail more than once a week (45%) or weekly (17%). Only 13% of visitors reported that it was their first time at that trail. Visitors were primarily biking (42%) or hiking (27%). Moreover, the average visitor did not experience conflict with other visitors on the trail (93%), and seven out of 10 visitors did not feel crowded while on the trail. On a scale of 1 (poor) to 10 (excellent), visitors rated BCPOS neighborhood and regional trails an average of 8.9, which is slightly lower than the ratings for park properties from 2021’s Five Year Visitor Study rating of 9.0. In reference to the park they were visiting, 66% of visitors described the number of trail miles as being about right. Lastly, 85% of visitors reported they prefer crushed rock over concrete for the trail surface, and slightly more visitors reported a preference for the edges of the trail to be mowed (40%) than not (34%).
Future Management
These surveys confirmed differences in visitation trends and visitor demographics when comparing parks with the regional and neighborhood trails. For example, visitors to regional and neighborhood trails are much more likely to use human-powered transportation, with 68% of visitors hiking, biking, and running to get to trails compared to 12% at parks. They are also more likely to visit frequently, with 74% of visitors going monthly, weekly, or more than once a week compared to 45% of visitors at parks in 2021.
The information and opinions gathered from visitors in these surveys are used in conjunction with other visitor studies to better manage the land and address community preferences. These surveys provide a snapshot of who our visitors are at various trails, which helps us to update and create management plans. Input from our visitors helps us understand what our visitors value. It also helps us respond to requests for specific amenities, trails, and types of land management.
The next time you are on a trail and see someone handing out surveys, we hope you will take the time to stop and fill one out. The input you provide can have an impact on the decisions that managers make for the future of your open space!
Read the entire Regional and Neighborhood Trail Visitor Study.