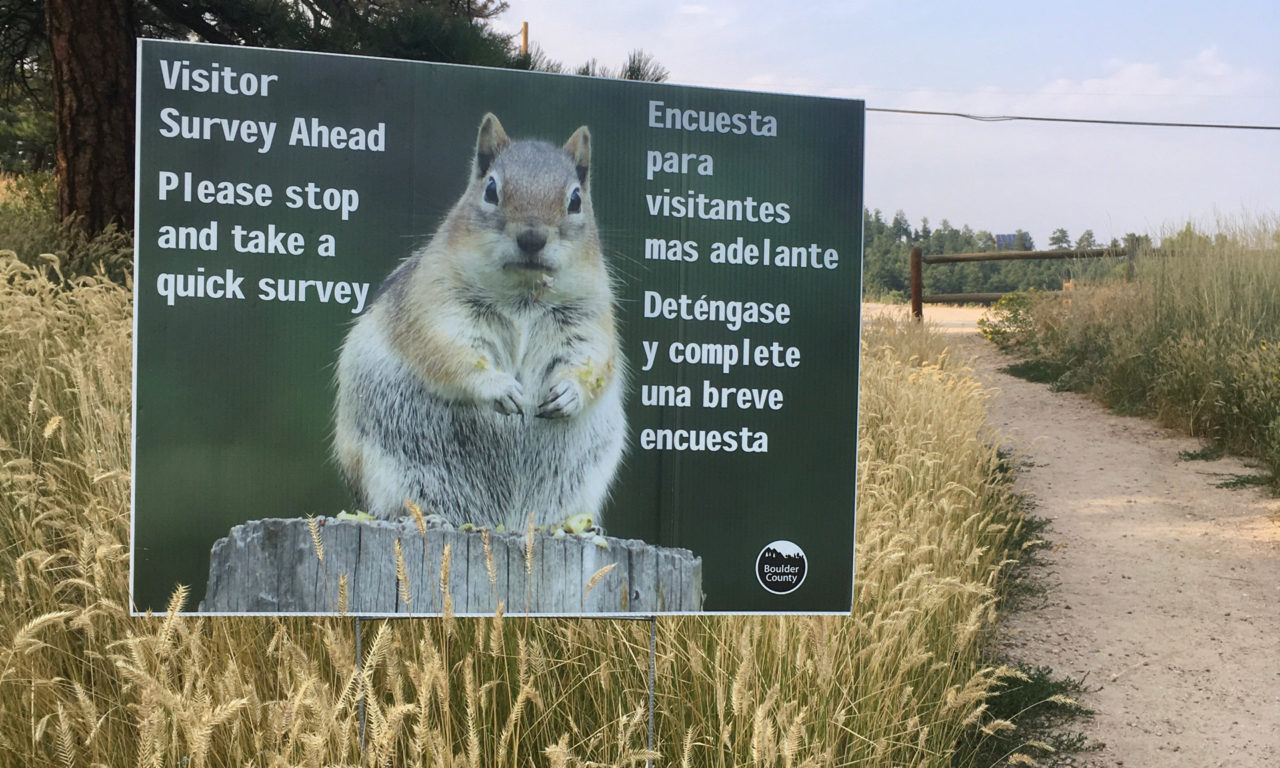
Every five years since 1990, Boulder County Parks & Open Space (BCPOS) staff and volunteers have hit the trails and asked visitors to fill out a survey about county parks. If you completed a survey last year, we really appreciate your taking the time to participate.
This county-wide survey, offered on county-owned open space properties, is used to collect information about long-term trends regarding visitors and open space management. The goal is to better understand who visits our parks, what activities they enjoy, and their satisfaction with the park experience. We want to learn how we can improve parks for you, the visitor.
Initially planned for 2020, the study was delayed a year because of the pandemic and took place during the spring and summer of 2021. Trained staff and volunteers collected 2,261 surveys at 15 park properties. Surveys for regional and neighborhood trails are being completed separately and are being collected this year.
Key Findings
Visitors to parks tended to visit either with family (44%) or by themselves (33%). If it was not their first time visiting a park (31%), they generally visited the trails frequently (44% visited monthly, weekly, or more than once a week). Visitors were most often from Boulder County (76%) and likely lived in Boulder (24%) or Longmont (20%). The most common age range for visitors was 25 to 44 (39%) or 45 to 64 (36%).
Most park visitors traveled to the park by car (89%). The trailheads with the greatest percentage of respondents reporting driving include Ron Stewart Preserve at Rabbit Mountain (99%) and Mud Lake (99%). Trailheads with the greatest percentage of visitors that reported biking, hiking/walking, or running to the park are close to urban development, including Carolyn Holmberg Preserve at Rock Creek Farm (58%) and Coalton Trailhead (37%).
Visitors were primarily hiking (55%) or biking (21%), which is consistent with previous surveys. Overwhelmingly, open space visitors did not experience conflict with others (95%), and three out of four visitors did not feel crowded at the trailhead or on the trail.
On a scale of 1 (poor) to 10 (excellent), visitors rated BCPOS parks an average of nine, which is a slight increase from the 2015 rating of 8.7. The top three highest-rated parks were Bald Mountain Scenic Area (9.6), Anne U. White Trail (9.6), and Caribou Ranch (9.4). The three lowest-rated parks were Legion Park (8.2), Walden Ponds Wildlife Habitat (8.6), and Lagerman Agricultural Preserve (8.6).
Regarding social preferences, visitors reported they support multi-use trails (63%), and a smaller majority also support designating trails for a single activity (54%). Visitors were less likely to support requiring specific days for various activities (41%).
In reference to the park they were visiting, 69% of visitors described the number of trail miles as being about right. Forty-seven percent of visitors reported that they prefer trails that are wide enough for two people side-by-side, and 29% of visitors preferred trails wide enough for three people side-by-side.
In the report you can find individual park summaries with data highlights and the most common visitor suggestions for improvements for that specific park.
Future Management
These Five Year Visitor studies complement other annual research and are one of many tools we use to better understand our visitors. The information and opinions we gather are used, in conjunction with the other visitor studies and tools, to better manage the land and address community desires. The report provides a snapshot of who our visitors are at various properties, which is used to help update management plans. The information can also be used to help us better understand the values of our communities, determine where more education or enforcement is wanted, and respond to community desires for specific amenities, trails, and types of management.
The next time you are on a trail and see someone handing out surveys, we hope you will take the time to stop and fill it out. The input you provide can impact the decisions that managers make for the future of your open space!