Last summer, while you were outside enjoying your local trails, were you asked to fill out a survey? That survey is one tool we use to collect information about visitors and gather feedback about open space management. We want to know who our visitors are, what activities they enjoy, how they describe their experience, and ways we can improve in the future.
To answer these questions and more, every five years, Boulder County Parks & Open Space (BCPOS) conducts a system-wide demographics and satisfaction survey. These five year studies complement regular annual studies and look at long-term trends in visitor demographics, preferences, and behaviors.
During the spring and summer of 2015, trained staff and volunteers collected 2,275 surveys at 14 parks and five regional or neighborhood trails.
Findings
When a visitor travels to a Boulder County property, they most likely travel by car (89 percent), whereas when a visitor travels to a Boulder County regional or neighborhood trail they most likely use alternative transportation such as biking, hiking, and running (53 percent). Visitors tend to visit either with family (41 percent) or alone (34 percent), and probably did not bring a dog (80 percent). If it is not their first time visiting the park (28 percent), they generally visit trails frequently (53 percent visited monthly, weekly, or more than once a week).
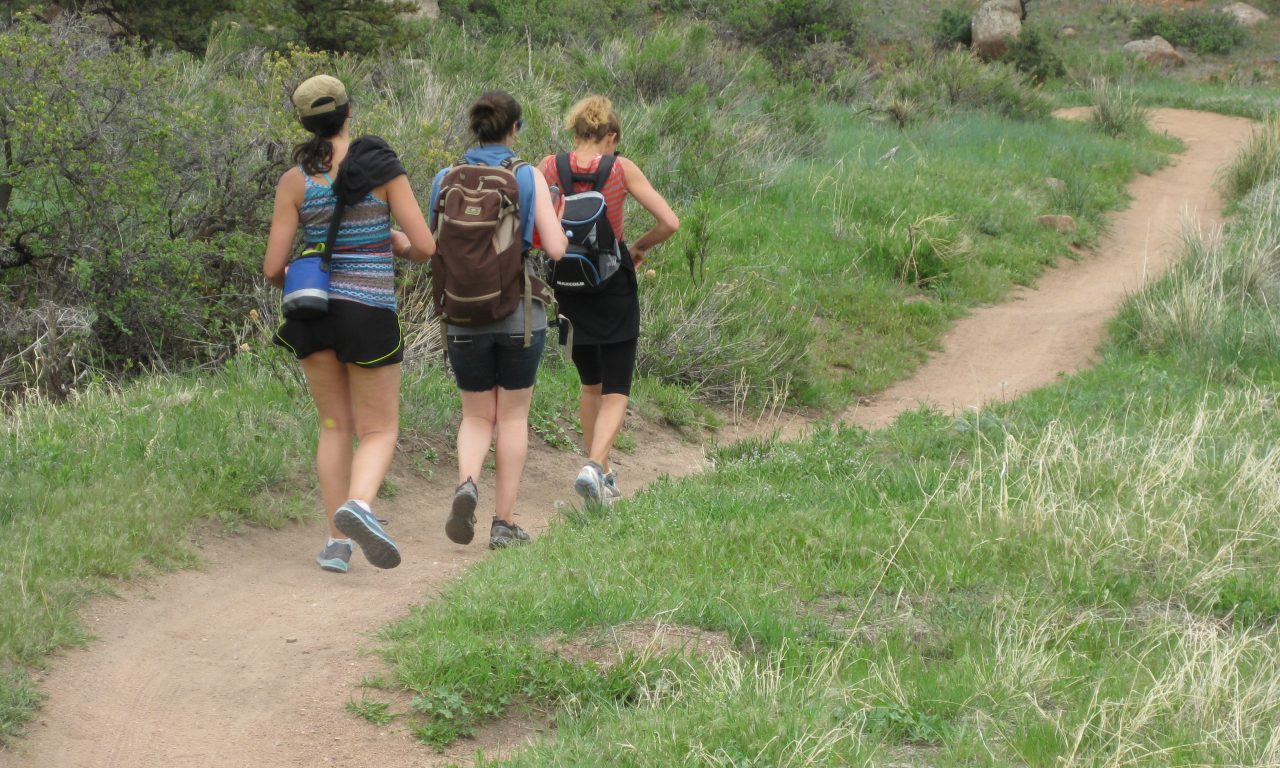
The visitor is most likely hiking (41 percent) or biking (27 percent) and did not experience conflict with other visitors on the trail (91 percent). Regardless of whether the visitor experienced conflict, most park visitors did not feel crowded during their visit (70 percent).
Findings indicate that the average visitor:
- has lived in Boulder County for 10 or more years (58 percent)
- likely lives in Boulder (31 percent) or Longmont (16 percent)
- is between years 45 to 64 (33 percent) or
- 25 to 44 (31 percent) years old
- is slightly less likely to own a dog
- (46 percent) than not (54 percent)
- is slightly more likely to be male
- (53 percent) than female (45 percent)
- has a bachelor’s (41 percent), master’s or PhD degree (37 percent)
- self-identifies as white (92 percent)
Overall Satisfaction
Most visitors are happy with the quality of the facilities (4.3 out of 5 overall facility rating). On a scale of 1 (poor) to 10 (excellent), visitors rated BCPOS land at an average of 8.7.
Visitors prefer trails wide enough for two people (43 percent) or three people (27 percent) to walk side-by-side and feel that there are about the right number of trails at that park or trail (63 percent). Visitors support or strongly support both multi-use trails (69 percent) and trails for a single activity (65 percent).
Future Management
The information and opinions gathered from visitors is used in conjunction with other visitor studies and tools to better manage the land and address community desires. The report provides a snapshot of who our visitors are at various properties, which is used to help update management plans. The information can also be used to help us better understand the values of our communities, to determine where more education or enforcement is wanted, and to respond to community desires for specific amenities, facilities, trails, and types of management.
The next time you are on a trail and see someone handing out surveys, we hope you will take the time to stop and fill it out. Don’t forget that the input you provide can have an impact on the decisions that managers make for the future of your open space!
Read the entire Five Year Visitor Study.